Yield Curve 101
Get Up to Speed Quickly on Yield Curves
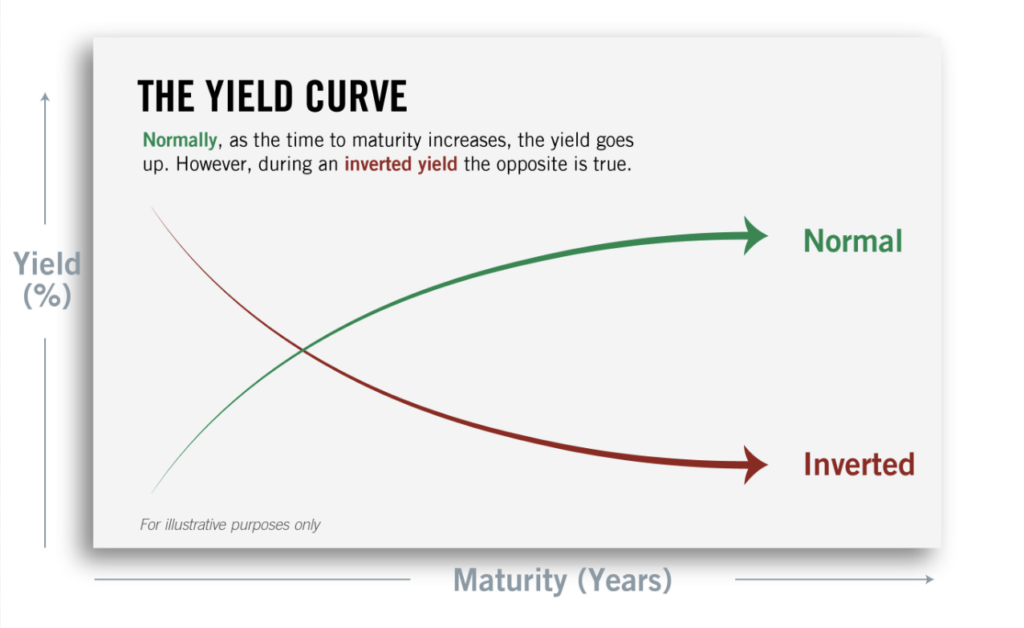
In finance, the yield curve is a graph which depicts how the yields on debt instruments – such as bonds – vary as a function of their years remaining to maturity.
Typically, the graph’s horizontal or x-axis is a time line of months or years remaining to maturity, with the shortest maturity on the left and progressively longer time periods on the right. The vertical or y-axis depicts the annualized yield to maturity.
Dig Deeper – Yield Curve 101: Reliable Sources of Information
Yield Curve 101: Steep, Flat, Inverted – What’s The Difference?
Seeking Alpha (“the world’s largest investing community”)
Yield Curve 101: The Ultimate Guide for ETF Investors
Yahoo Finance (by Daniela Pylypczak)
What is a Yield Curve? (with videos)
Investopedia (by Adam Hayes)
Introduction to the Yield Curve (10 minute tutorial)
Khan Academy